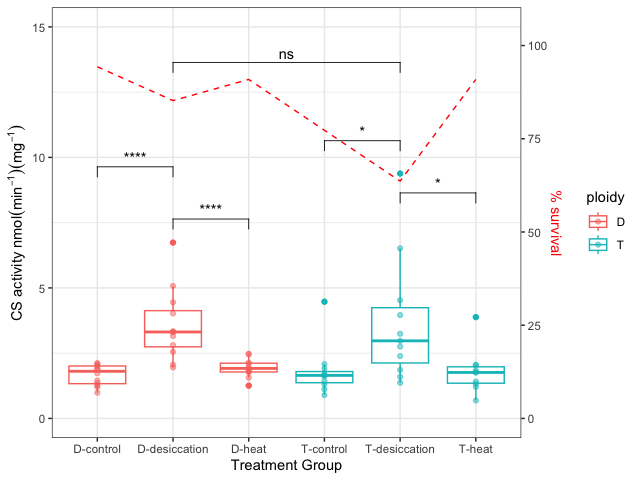
Updated R studio script to make it more reproducable and in plain english
- set new protein curve using only linear portions of the curve
- averaged technical replicates for each oyster
- set universal protein and CS curve for easy analysis
- checked background wells for autoflourescence (not significant)
Results
- updated regression analysis to include D-desiccation to the significant list in addition to T-desiccation
- overall reduced total CS values
